


Trusted by over 15 Million Traders
The Most Awarded Broker
for a Reason
Easy Access to 1,400+ Global Assets
EURUSD
Euro vs U.S. Dollar
US500
S&P 500 (US500)
GOLD
Gold
COFFEE
US Coffee
Apple
Apple (AAPL.OQ)
-

Finance Magnates 颁发
-

Finance Magnates 颁发
-

Capital Finance International Magazine (CFI.co) 2024年颁赠
-

COLWMA 2024年颁赠
-

荣获World Finance Forex Awards 2023最佳外汇客户服务奖
-

荣获World Finance Forex Awards 2023欧洲最佳外汇经纪商奖
-

荣获World Finance Forex Awards 2023澳大拉西亚最佳外汇经纪商奖
-

荣获World Finance Forex Awards 2023拉丁美洲最佳外汇经纪商奖
-

荣获World Finance Forex Awards 2023中东最佳外汇经纪商奖
-

CFI.co于2023年颁赠
-

荣获2023年City of London Wealth Management Awards
-

荣获2022年埃及金融博览会颁赠
-

荣获2022年City of London Wealth Management Awards
-

CFI.co于2022年颁赠
-

荣获Global Forex Awards 2022 — 零售外汇 颁赠
-
2021年迪拜外汇博览会获颁赠
-

Ultimate Fintech 2021年颁赠
-

荣获2021年City of London Wealth Management Awards
-

FX168于2020年12月颁赠
-

荣获Global Business Awards 2020
-

荣获2020年City of London Wealth Management Awards
-

Capital Finance International Magazine (CFI.co)颁赠
-

Capital Finance International Magazine (CFI.co)颁赠
-

荣获2019年City of London Wealth Management Awards
-

Shares Magazine 授予 UK Forex Awards 2018
-

Capital Finance International Magazine (CFI.co)颁赠
-

Capital Finance International Magazine (CFI.co)颁赠
-

2017年伦敦财富管理奖
-

2016最佳本土 客户服务
-

中东和北非地区(MENA)增长最快的经纪商
-
2015年最佳外汇科技提供商
-
2014年最佳外汇科技提供商
-

2014年最佳外汇科技提供商
-

荣获 The Trading Show 2024年非洲 Africa Fintech 峰会颁赠
-

荣获2024年中东地区 Brokersview 颁赠
-
荣获2024年中东地区 Brokersview 颁赠
-

荣获2024年阿曼 Smart Vision 峰会颁赠
-

荣获2024年迪拜外汇博览会颁赠
-

荣获2024年迪拜 Forex Traders Summit 颁赠
-

2024年埃及 Smart Vision 峰会颁赠
-

投查查于2024年颁赠
-

Capital Finance International Magazine (CFI.co) 2024年颁赠
-

CFI.co于2023年颁赠
-

CFI.co于2023年颁赠
-

交易社区平台FOLLOWME于2022年颁赠
-
2022年迪拜Forex Expo获颁赠
-
2022年迪拜Forex Expo获颁赠
-

荣获Global Forex Awards 2022 — 零售外汇 颁赠
-

CFI.co于2022年颁赠
-

CFI.co于2022年颁赠
-

World Finance Forex Awards 2022 颁发
-

World Finance Forex Awards 2022 颁发
-

World Finance Forex Awards 2022 颁发
-

World Finance Forex Awards 2022 颁发
-
交易社区平台FOLLOWME于2021年颁赠
-

2021年埃及Smart Vision Investment Expo博览会获颁赠
-

CFI.co于2021年颁赠
-

CFI.co于2021年颁赠
-

荣获Global Forex Awards 2021 — 零售外汇 颁赠
-

荣获Global Forex Awards 2021 — 零售外汇 颁赠
-

World Finance 2021颁发
-

World Finance 2021颁发
-
FOLLOWME于2021年颁赠
-

Global Forex Awards 2021 — B2B 颁赠
-

Global Forex Awards颁赠
-

Global Forex Awards颁赠
-

CFI.co于2020年颁赠
-

CFI.co于2020年颁赠
-

荣获Global Business Awards 2020
-

World Finance Magazine 颁赠
World Finance Forex Awards 2020 -

World Finance Magazine 颁赠
World Finance Forex Awards 2020 -
FOLLOWME交易社区授予
-

Global Forex Awards颁赠
-

Global Forex Awards颁赠
-

FinTech Age Awards颁发
-

World Finance Magazine 颁赠
World Finance Forex Awards 2019 -

World Finance Magazine 颁赠
World Finance Forex Awards 2019 -

荣获 World Finance Forex Awards 2018 颁赠
-

荣获2018年埃及金融博览会颁赠
-

荣获 Shares Magazine 的 UK Forex Awards 2017 颁赠
-

荣获 World Finance Forex Awards 2017
-

2016年最佳黄金经纪商
-

2016年最佳外汇经纪商
-

2015年最佳本地客户服务
-

Global Brands Magazine 颁赠
-

Online Money Awards 2022 颁发
-

荣获2022年埃及金融博览会颁赠
-

2015最佳外汇交易平台
-

2015最佳金融交易平台
-

2013最佳创新外汇平台奖
-

2020年 Cyprus HR Awards 颁赠
-

金融行业的佼佼者
-

认证最优金牌级别
-

2014年首届亚军
-
Finance Magnates 颁发
-
Finance Magnates 颁发
-
Capital Finance International Magazine (CFI.co) 2024年颁赠
-
COLWMA 2024年颁赠
-
荣获World Finance Forex Awards 2023最佳外汇客户服务奖
-
荣获World Finance Forex Awards 2023欧洲最佳外汇经纪商奖
-
荣获World Finance Forex Awards 2023澳大拉西亚最佳外汇经纪商奖
-
荣获World Finance Forex Awards 2023拉丁美洲最佳外汇经纪商奖
-
荣获World Finance Forex Awards 2023中东最佳外汇经纪商奖
-
CFI.co于2023年颁赠
-
荣获2023年City of London Wealth Management Awards
-
荣获2022年埃及金融博览会颁赠
-
荣获2022年City of London Wealth Management Awards
-
CFI.co于2022年颁赠
-
荣获Global Forex Awards 2022 — 零售外汇 颁赠
-
2021年迪拜外汇博览会获颁赠
-
Ultimate Fintech 2021年颁赠
-
荣获2021年City of London Wealth Management Awards
-
FX168于2020年12月颁赠
-
荣获Global Business Awards 2020
-
荣获2020年City of London Wealth Management Awards
-
Capital Finance International Magazine (CFI.co)颁赠
-
Capital Finance International Magazine (CFI.co)颁赠
-
荣获2019年City of London Wealth Management Awards
-
Shares Magazine 授予 UK Forex Awards 2018
-
Capital Finance International Magazine (CFI.co)颁赠
-
Capital Finance International Magazine (CFI.co)颁赠
-
2017年伦敦财富管理奖
-
2016最佳本土 客户服务
-
中东和北非地区(MENA)增长最快的经纪商
-
2015年最佳外汇科技提供商
-
2014年最佳外汇科技提供商
-
2014年最佳外汇科技提供商
-
荣获 The Trading Show 2024年非洲 Africa Fintech 峰会颁赠
-
荣获2024年中东地区 Brokersview 颁赠
-
荣获2024年中东地区 Brokersview 颁赠
-
荣获2024年阿曼 Smart Vision 峰会颁赠
-
荣获2024年迪拜外汇博览会颁赠
-
荣获2024年迪拜 Forex Traders Summit 颁赠
-
2024年埃及 Smart Vision 峰会颁赠
-
投查查于2024年颁赠
-
Capital Finance International Magazine (CFI.co) 2024年颁赠
-
CFI.co于2023年颁赠
-
CFI.co于2023年颁赠
-
交易社区平台FOLLOWME于2022年颁赠
-
2022年迪拜Forex Expo获颁赠
-
2022年迪拜Forex Expo获颁赠
-
荣获Global Forex Awards 2022 — 零售外汇 颁赠
-
CFI.co于2022年颁赠
-
CFI.co于2022年颁赠
-
World Finance Forex Awards 2022 颁发
-
World Finance Forex Awards 2022 颁发
-
World Finance Forex Awards 2022 颁发
-
World Finance Forex Awards 2022 颁发
-
交易社区平台FOLLOWME于2021年颁赠
-
2021年埃及Smart Vision Investment Expo博览会获颁赠
-
CFI.co于2021年颁赠
-
CFI.co于2021年颁赠
-
荣获Global Forex Awards 2021 — 零售外汇 颁赠
-
荣获Global Forex Awards 2021 — 零售外汇 颁赠
-
World Finance 2021颁发
-
World Finance 2021颁发
-
FOLLOWME于2021年颁赠
-
Global Forex Awards 2021 — B2B 颁赠
-
Global Forex Awards颁赠
-
Global Forex Awards颁赠
-
CFI.co于2020年颁赠
-
CFI.co于2020年颁赠
-
荣获Global Business Awards 2020
-
World Finance Magazine 颁赠
World Finance Forex Awards 2020 -
World Finance Magazine 颁赠
World Finance Forex Awards 2020 -
FOLLOWME交易社区授予
-
Global Forex Awards颁赠
-
Global Forex Awards颁赠
-
FinTech Age Awards颁发
-
World Finance Magazine 颁赠
World Finance Forex Awards 2019 -
World Finance Magazine 颁赠
World Finance Forex Awards 2019 -
荣获 World Finance Forex Awards 2018 颁赠
-
荣获2018年埃及金融博览会颁赠
-
荣获 Shares Magazine 的 UK Forex Awards 2017 颁赠
-
荣获 World Finance Forex Awards 2017
-
2016年最佳黄金经纪商
-
2016年最佳外汇经纪商
-
2015年最佳本地客户服务
-
Global Brands Magazine 颁赠
-
Online Money Awards 2022 颁发
-
荣获2022年埃及金融博览会颁赠
-
2015最佳外汇交易平台
-
2015最佳金融交易平台
-
2013最佳创新外汇平台奖
-
2020年 Cyprus HR Awards 颁赠
-
金融行业的佼佼者
-
认证最优金牌级别
-
2014年首届亚军

Awarded BestBrokerYear After Year
CATEGORIES
News
- 【XM Forex】--GBP/USD Forecast: Races into Resistance
- 【XM Group】--EUR/USD Analysis: Upward Rebound Gains May Remain Weak
- 【XM Market Analysis】--Silver Forecast: Bounces From Trendline
- 【XM Decision Analysis】--Pairs in Focus - Gold, Silver, DAX, BTC/USD, USD/CAD, US
- 【XM Group】--Pairs in Focus - Gold, EUR/USD, AUD/USD, NZD/USD, NASDAQ 100, WTI Cr
market news
The moon line is long and the feet are big sun, and gold and silver are empty after May
Wonderful Introduction:
The moon has phases, people have joys and sorrows, whether life has changes, the year has four seasons, after the long night, you can see dawn, suffer pain, you can have happiness, endure the cold winter, you don’t need to lie down, and after all the cold plums, you can look forward to the New Year.
Hello everyone, today XM Foreign Exchange will bring you "[XM Foreign Exchange Decision Analysis]: The monthly line is long and the feet are big, and gold and silver are long after the sky in May". Hope it will be helpful to you! The original content is as follows:
Today is Labor Day, May 1st. First of all, I wish all investors a happy Labor Day!
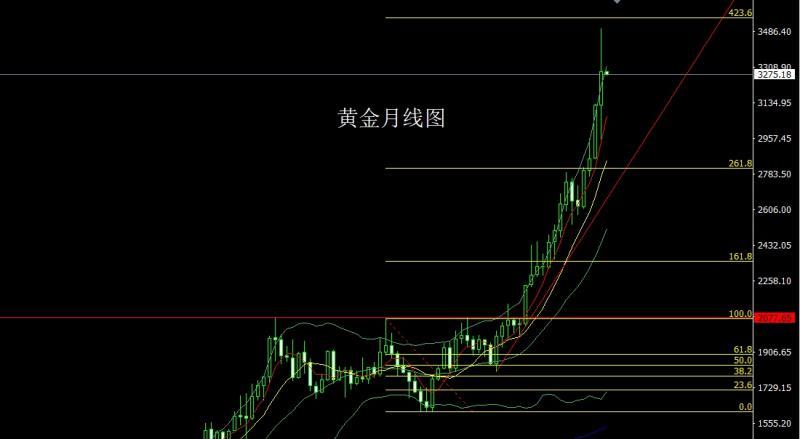
Yesterday, the gold market www.xm-forex.completed its structure in April. Looking back at the beginning of the month, the market opened at the 3124.6 position and the market fell first at the beginning of the month. The monthly line was at the lowest point of 2953.8 and then the market rose strongly. The monthly line reached the highest point of 3500.4 position and then the market took profit and fell. The monthly line finally closed at the 3288.3 position and the market closed with a large positive line with an upper and lower shadow line. After this pattern ended, technically, the monthly line will enter the large-range consolidation cycle.
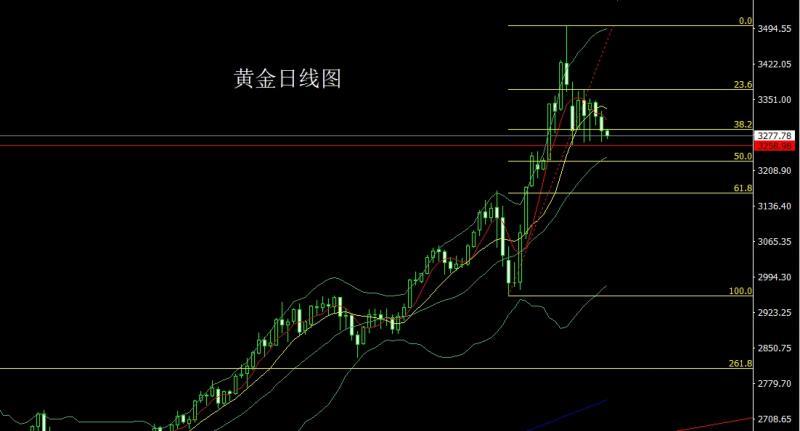
Yesterday, the gold market opened at 3316.6 in the morning, and the market first rose, and then the position of 3328.5 in the morning. The market fluctuated and fell. The daily line was at the lowest point of 3266.3. The market rose strongly and gave the position of 3320.2 in the evening. The daily line finally closed at 3288.3. Then the market closed with a very long lower shadow line. After this pattern ended, the short position of 3496, 3468 and 3442 last week, and the stop loss followed at 3400. Today, the morning trading fell first 3266, long conservative 3263, long stop loss 3259, and the target was 3282 and 3290 breaking the position and looking at 3300-3303 pressure www.xm-forex.competition. At the same time, 3258 has broken the gap and stop loss of 3265, the target is 3250 amounts 3242 and 3235-3225 support.
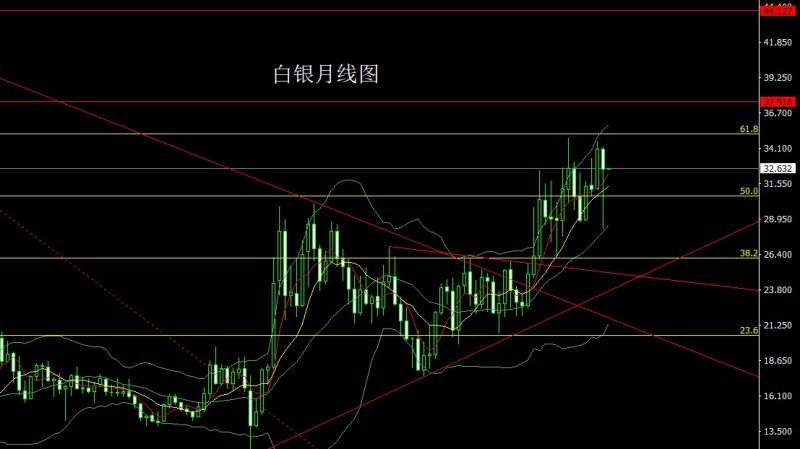
The silver market opened at the beginning of April at 34.109 and then rose slightly. The market fell sharply. The monthly line was given the lowest position of 28.225. The market was affected by the technical monthly line Bollinger's middle track and the risk aversion news. The market was once again given the position of 33.683. After the market was consolidated. The monthly line finally closed at 32.604 and then closed with a hammer head with an extremely long lower shadow line. After this pattern ended, the monthly line had a demand for a higher rise.
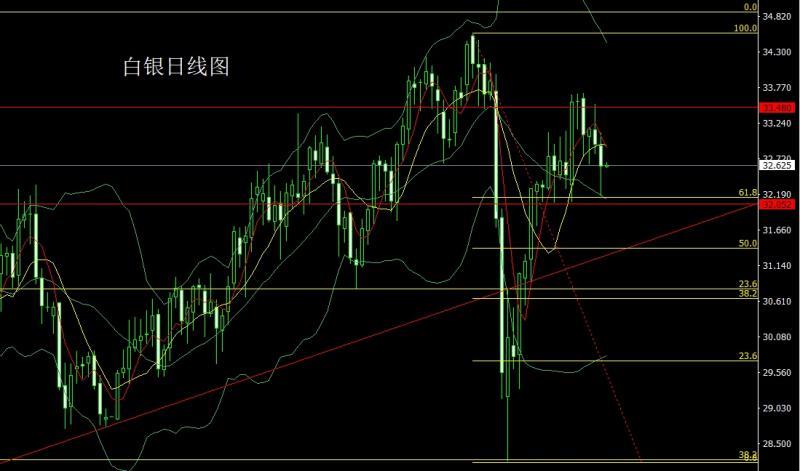
The silver market opened at 32.908 yesterday and then the market first rose. The market fell strongly. The daily line was at the lowest point of 32.17 and then the market rose strongly. The daily line finally closed at 32.604. Then the market closed with a very long lower shadow line. After this pattern ended, 32.3 was more stop loss at 32.1 today, and the target was 32.6 and 32.8-33 pressure.
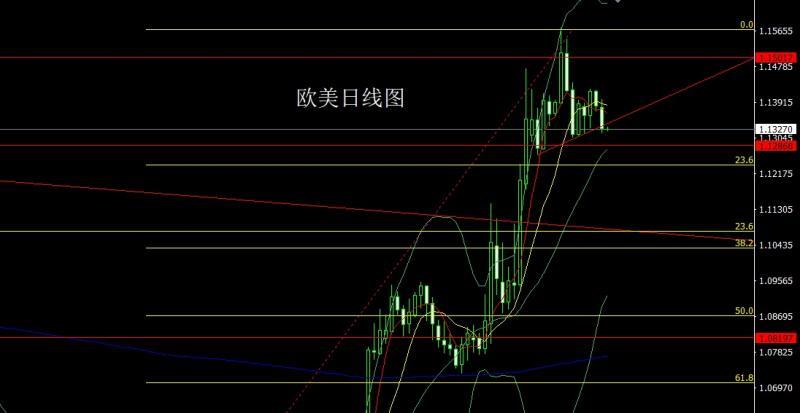
European and American markets opened at 1.13801 yesterday and the market rose slightly. After giving a position of 1.13997, the market fell sharply. The daily line was at the lowest point of 1.13159 and the market consolidated. The daily line finally closed at 1.13287 and the market closed with a large negative line with a long upper shadow line. After this pattern ended, the short stop loss of 1.13650 today. The target below is 1.13150, and the falling below is 1.13000 and 1.12900-1.12700.
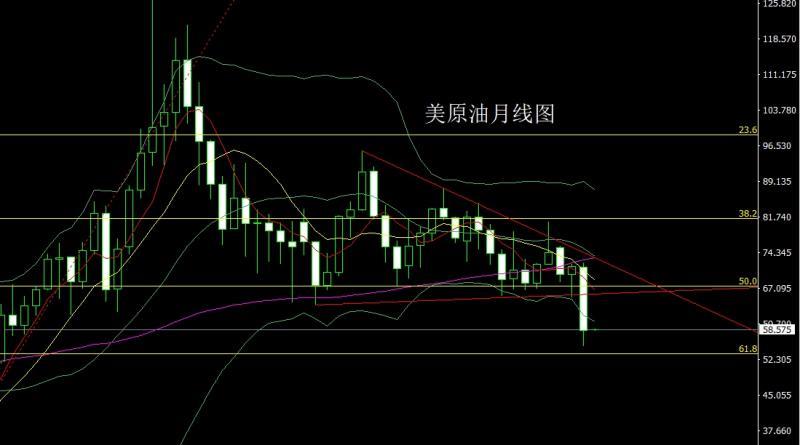
The US crude oil market opened at the beginning of April at the beginning of the month and then rose slightly. The monthly line was at the high point of 72.38, and the market fell strongly. The monthly line was at the lowest point of 55.14. The market finally closed at the position of 58.39. After the market closed with a large negative line with a long lower shadow line. After this pattern ended, the US crude oil market had pressure to continue to fall. At the point, the short stop loss of 59.6 today was 60.1. The target below was 58 and 57.2 and 56.5.
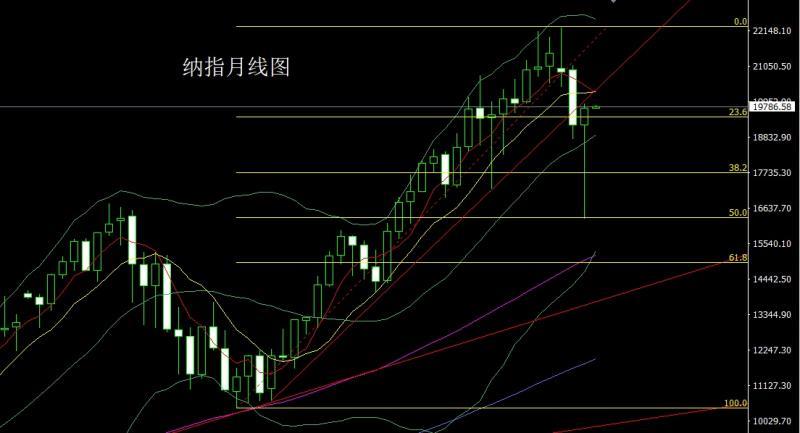
The Nasdaq market opened at the beginning of April at 19226.12, and then the market rose first to give the monthly high point of 19879.8.The situation fell strongly, and the monthly line was at the lowest level of 16303.33, and the market fluctuated strongly. The monthly line finally closed at the position of 19737.04, and the market closed with a hammer head with a very long lower shadow line. After this pattern ended, the stop loss of 19400 is more than 19300 today, with the target of 19900 and 20000-20100.
Basics, the tariff war just ended in April has become the theme of the world. Under the fierce confrontation between China and the United States, the global financial market has caused huge waves. Gold is here to be back. The situation hit a record high of 3,500, and the US index fell strongly. As of now, such disputes will continue in May. However, with China's strong counterattack, the US's 6.5 trillion U.S. bonds that are about to expire in June are about to expire and no one takes over, time is gradually standing on the side of global justice such as China. If the United States cannot solve the most important debt problem in May under the China pressure, the consequence of the US debt default is that the United States will lose its credit soon, and the United States will also fall to the global hegemony's low, so who can tell at the end. Yesterday's fundamentals US economic data weakened sharply, "small non-agricultural" plummeted, with employment only increasing by 62,000; the US economy contracted for the first time since 2022, with GDP falling by 0.3% in the first quarter; the US core PCE price index recorded a monthly rate of 0%, a new low since April 2020, lower than expected 0.1%. Today's fundamentals focus mainly on the number of initial unemployment benefits in the United States from 20:30 to April 26. Look at the final value of the US S&P Global Manufacturing PMI in April at 21:45 later, look at the final value of the US April ISM Manufacturing PMI in April at 22:00 later and the monthly rate of construction expenditure in March.
In terms of operation, gold: After short positions of 3496, 3468 and 3442 were reduced last week, the stop loss followed at 3400. It fell back to 3266 long and conservative 3263 long and stop loss 3259. The target is 3282 and 3290 breaking the position and see 3300-3303 pressure www.xm-forex.competition. At the same time, the 3258 hangs and breaks the short stop loss of 3265, and the target is 3250 3242 and 3235-3225 support.
Silver: Today's 32.3 long stop loss is 32.1, with a target of 32.6 and 32.8-33 pressure.
Europe and the United States: 1.13650 short stop loss today 1.13850, the target below is 1.13150, the target below is 1.13000 and 1.12900-1.12700.
U.S. crude oil: 59.6 short stop loss today 60.1, the target below is 58 and 57.2 and 56.5.
Nasdaq: 19400 short stop loss today 19300, the target target is 19900 and 20000-20100.
The above content is all about "[XM Foreign Exchange Decision Analysis]: The monthly line is long and the feet are big, and gold and silver are long after the short in May". It was carefully www.xm-forex.compiled and edited by the editor of XM Foreign Exchange. I hope it will be helpful to your trading! Thanks for the support!
I have done something and I will always have experienceand lessons. In order to facilitate future work, we must analyze, study, summarize and concentrate the experience and lessons of previous work, and raise it to the theoretical level to understand it.
Disclaimers: XM Group only provides execution services and access permissions for online trading platforms, and allows individuals to view and/or use the website or the content provided on the website, but has no intention of making any changes or extensions, nor will it change or extend its services and access permissions. All access and usage permissions will be subject to the following terms and conditions: (i) Terms and conditions; (ii) Risk warning; And (iii) a complete disclaimer. Please note that all information provided on the website is for general informational purposes only. In addition, the content of all XM online trading platforms does not constitute, and cannot be used for any unauthorized financial market trading invitations and/or invitations. Financial market transactions pose significant risks to your investment capital.
All materials published on online trading platforms are only intended for educational/informational purposes and do not include or should be considered for financial, investment tax, or trading related consulting and advice, or transaction price records, or any financial product or non invitation related trading offers or invitations.
All content provided by XM and third-party suppliers on this website, including opinions, news, research, analysis, prices, other information, and third-party website links, remains unchanged and is provided as general market commentary rather than investment advice. All materials published on online trading platforms are only for educational/informational purposes and do not include or should be considered as applicable to financial, investment tax, or trading related advice and recommendations, or transaction price records, or any financial product or non invitation related financial offers or invitations. Please ensure that you have read and fully understood the information on XM's non independent investment research tips and risk warnings. For more details, please click here